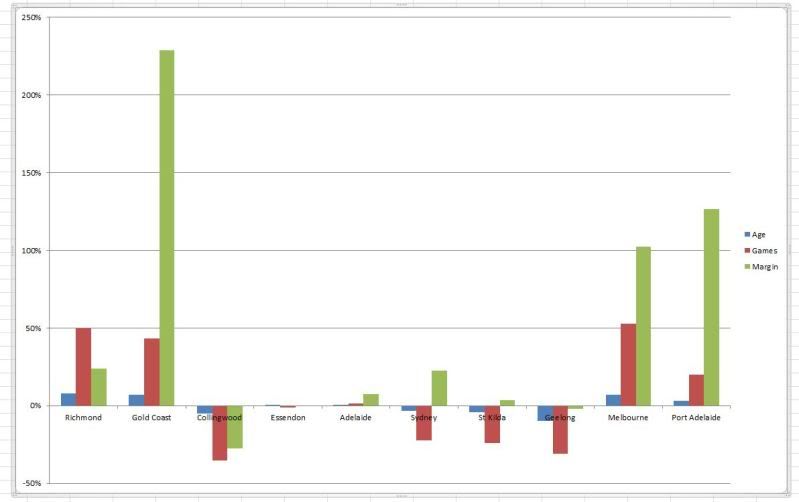
Comparison with opposition
Age difference as a percentage
Games played difference as a percentage
Margin result as a percentage
| TalkingCarlton http://www.talkingcarlton.com/phpBB3/ |
|
| The 10 Games Played Graph http://www.talkingcarlton.com/phpBB3/viewtopic.php?f=2&t=30146 |
Page 1 of 1 |
| Author: | verbs [ Thu Jun 09, 2011 2:46 pm ] |
| Post subject: | The 10 Games Played Graph |
Comparison with opposition Age difference as a percentage Games played difference as a percentage Margin result as a percentage
|
|
| Author: | Sydney Blue [ Thu Jun 09, 2011 2:51 pm ] |
| Post subject: | Re: The 10 Games Played Graph |
Nice graph there Verbs took me a couple of minutes to work it out With the age % difference is never going to be much and showw up on the graph It would look better if you spanned it in 10 year block 20-30 |
|
| Author: | Punter22 [ Thu Jun 09, 2011 3:00 pm ] |
| Post subject: | Re: The 10 Games Played Graph |
There's plenty to like in that graph, but what that really shows to me is how well the boys have sustained their effort the last couple of weeks. It would have been easy to take the foot off the gas after that Collingwood > Geelong block (some might say we did to a degree first half against Port), but the margins say we did exactly what we would expect to do against lesser opposition. Hope it continues this week. |
|
| Author: | moshe25 [ Thu Jun 09, 2011 4:09 pm ] |
| Post subject: | Re: The 10 Games Played Graph |
Nice post, Jars. And what have you done with Verbs? |
|
| Author: | camel [ Thu Jun 09, 2011 4:18 pm ] |
| Post subject: | Re: The 10 Games Played Graph |
Experience counts. 
|
|
| Author: | ryan2000 [ Thu Jun 09, 2011 5:22 pm ] |
| Post subject: | Re: The 10 Games Played Graph |
NERD!!!! *cough* ....... I mean,.................. Good Work!
|
|
| Author: | Taff [ Thu Jun 09, 2011 5:38 pm ] |
| Post subject: | Re: The 10 Games Played Graph |
Where's Jars? He loves this stuff! Maybe he is lurking ...... |
|
| Author: | Spirit of Carlton [ Thu Jun 09, 2011 7:32 pm ] |
| Post subject: | Re: The 10 Games Played Graph |
nerd alert! |
|
| Author: | Hotcox [ Thu Jun 09, 2011 7:44 pm ] |
| Post subject: | Re: The 10 Games Played Graph |
Interesting graph, just shows you can pretty much work out a result of each game played before a ball is bounced. |
|
| Author: | GWS [ Thu Jun 09, 2011 8:34 pm ] |
| Post subject: | Re: The 10 Games Played Graph |
verbs wrote: Comparison with opposition Age difference as a percentage Games played difference as a percentage Margin result as a percentage Great graph! And I do love a great graph! Also proves my theory on Essendon*. If we're almost identically placed with them in terms of games and age then outside of their game with us they're underperforming massively. ie - they're a shit club. |
|
| Author: | Navy Blue Horse [ Thu Jun 09, 2011 9:45 pm ] |
| Post subject: | Re: The 10 Games Played Graph |
Hotcox wrote: Interesting graph, just shows you can pretty much work out a result of each game played before a ball is bounced. Would be interesting to know how many correct footy tips one would have is using these stats |
|
| Author: | Megaman [ Sun Jun 12, 2011 10:48 am ] |
| Post subject: | Re: The 10 Games Played Graph |
The graph can't be accurate because C.Ling just said the young teams (like Essendon*) need 5-6 hrs together before they are contenders. We must surely be way older than those kiddies 
|
|
| Page 1 of 1 | All times are UTC + 10 hours |
| Powered by phpBB® Forum Software © phpBB Group http://www.phpbb.com/ |
|